Direct parameter input
Upload .slha file

The two modes of SUSY-AI Online
The webapplication accepts input in two formats. You may either choose to enter all parameters of the model you want to find the exclusion of by hand or you may choose to upload a .slha file of your pMSSM (or pMSSM submodel).
Both these modes you can enter via the tabs on the top of the white box.
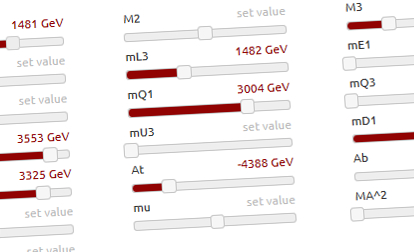
Defining the parameter values
You can enter all values of the asked parameters manually, either by use of sliders or by filling them in by hand (by clicking on 'set value' or the variable value).
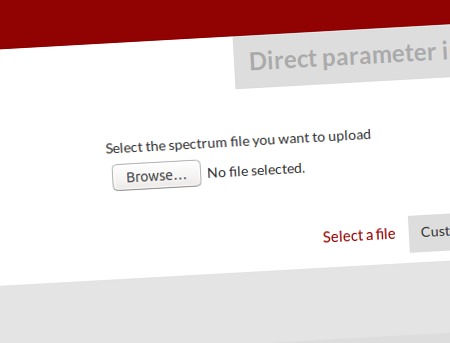
Uploading a .slha-file
Alternatively you may upload a .slha file. A .slha file contains the spectrum for the SUSY model you want to make a prediction for about its exclusion. This model has to have the lightest neutralino as lightest supersymmetric particle. The file you upload may have a maximum filesize of 500kB.
More information on .slha files can be found on the official website of the format: http://skands.physics.monash.edu/slha/.
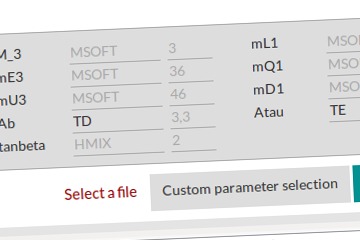
Customizing your parameter selection
SUSY-AI reads specific parameters out of the .slha file, but the location of these parameters may differ per file. If for any reason your parameter selection is invalid (i.e. not all parameters could be found), SUSY-AI will return an error message indicating which parameter was not found.
You can alter the identifiers of these parameters by clicking on the button "Custom parameter selection". There you can also see what the default parameter identifiers are. All block identifiers have to be entered in all caps.
Starting prediction
When you have selected a valid file or entered your coordinates, you can start the program by clicking the red "Predict" button.
A new box appearing in the bottom of your screen will indicate when the program is finished with calculating the exclusion of the uploaded spectrum.
Result meaning
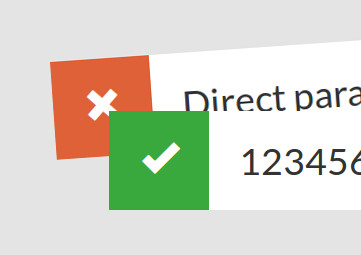
The result indicates if the uploaded spectrum is allowed (green tick) or excluded (red cross) by the results of ATLAS Run-I or ATLAS Run-II, depening on how the colour indication is configured.
By clicking on the result, more information on the result is shown. Prediction is a continuous variable indicating the probability the model is allowed, while Confidence gives the confidence the binary classification (allowed or excluded) has..
Icons in the result box
Depending on the parameter values you gave as input, the result bar may show some icons. These icons indicate the following:

Analysis and Confidence Levels
Instead of having to check and compare the confidences for multiple results yourself, you can indicate what the minimum confidence is you find acceptable for the binary classification. You can do this by selecting one of the CL buttons just above the results. By selecting an analysis in the Analysis selection, you indicate which confidence level will be used in the colour indication.
All results with a confidence level lower than you indicate will change colour to yellow, showing they cannot be classified with the required certainty.
This minimum confidence will automatically apply to all new predictions made.
Mapped results
The entered data may have their model laying outside of the range as sampled in the training data of SUSY-AI. If this is the case, the prediction as indicated by the colour of the result is made on the coordinate as mapped to the inside of this sampling range.
This mapping is only performed if the original coordinate was placed on the high energy side of the spectrum for that coordinate.
The original classification can still be inspected by clicking on the result. All text that has been striked through belongs to the original model as uploaded.
More information
More information on SUSY-AI or SUSY-AI Online can be found in the official paper and software documentation.
Want to make predictions right anyway? SUSY-AI can be downloaded to be run in your own environment!
Download now
If you encounter any problems, don't hesitate to contact us!
SUSY-AI and SUSY-AI Online (c) 2017
